Wondering if some can assist here with theories.
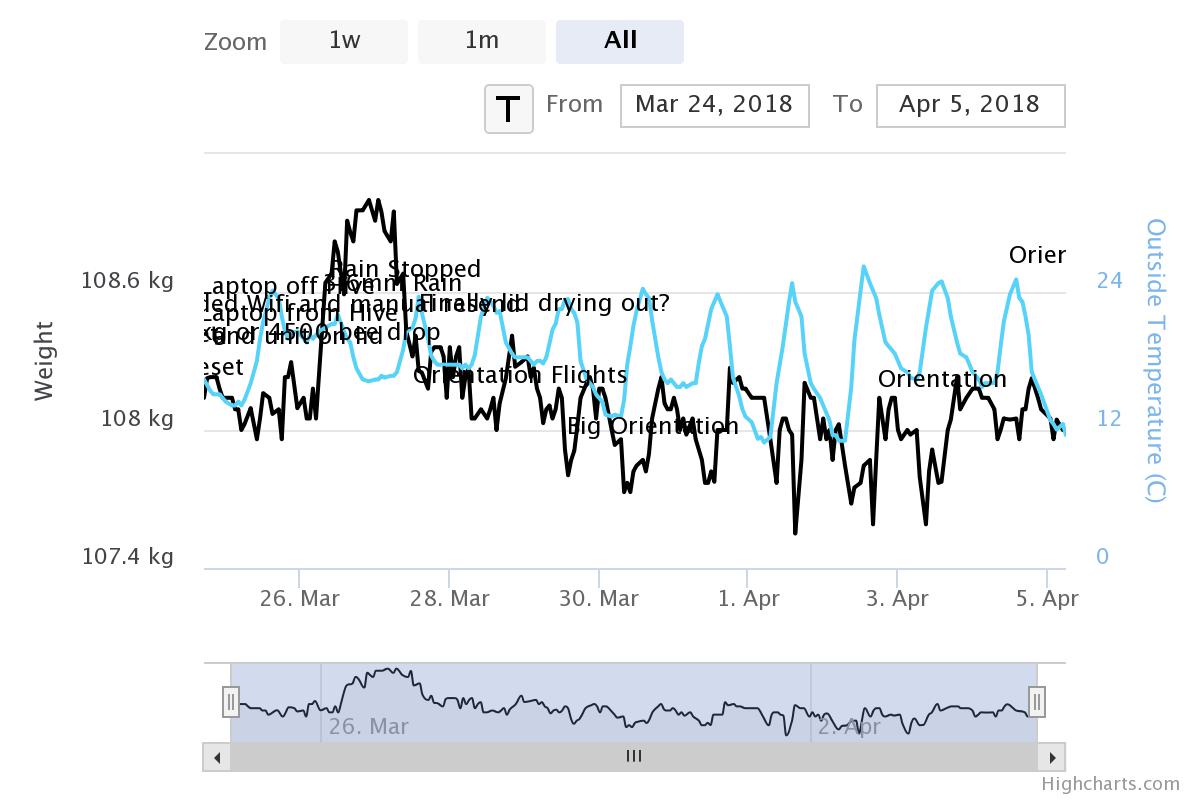
I have just put a scale on the hive and it seems to be going well. I have noticed though that in the morning shortly after the sun comes out (1-2hrs) the hive weight has been going up a kilo or two then quickly (over the next hour or two) dropping down quite a few kilo. I have been putting the drop down to the foragers leaving the hive but I can’t figure out why the weight is initially going up. Any ideas?
The theory that I would lean towards is that the bees must collect a lot of nectar real early in the morning. Then during the day the weight drops as the colony dewaters it.
Are you seeing an upward daily trend as the bees fill the honey frames?
Definitely a possibility Jeff; thanks for your thoughts. I wasn’t sure if they were capable of putting on such weight so quickly.
The weight overall has been steadily increasing since I put the scales down. They were doing a kilo a day for a while there but have tapered off a bit lately. Might be the weather though as it has been a bit rainy and overcast.
I’d say the bees bring in nectar promptly first thing, but the evaporator/fanning bees take a little while to start drying it? After they get going with that task, the evaporation plus further field bees heading off sees a decrease in the weight, before incoming nectar and returning bees again exceeds the rate of evaporation. Is the broodminder an expensive item?
I have read that warm and muggy weather (with no real rain) is good for nectar secretion in gum trees. Too wet is bad for nectar gathering generally I believe.
If you read the instructions on the device for Broodminder they warn about where the sun hits the scale as it impacts the reading. It might be a false reading based on that; maybe shield the scale from the sun and see if it makes a difference. I have 2 of them but haven’t put them out yet so I’m curious to hear what happens if you try that.
Your graph is a little puzzling, I agree. I have an Arnia hive scale, and my lowest weight is at 06:00. The highest weight is between 17:00 and 18:00. There is often a little bump down between 13:00 and 15:00 which coincides with a cloud of bees doing orientation flights outside the hive.
You can see that they are putting on 500 to 1100g per day, and fan it to dehumidify over night, dropping the weight progressively during the dark hours. I have heard of scales showing up to 2kg per day of gain (according to Arnia), but that seems to be exceptional.
The scale is at the front of the hive so I might try moving it to the back where the sun can’t get at it so easily.
See what that does.
I like your graph Dawn, that’s what I’d have thought I’d see.
I’ll report back in a week or so.
I think it depends on what sort of flow you have and the size/strength of your colony. Remember a bee weights 1/10g or 10 bees to 1g. I’m using the WiFiHiveScales which have a resolution of 40g from memory.
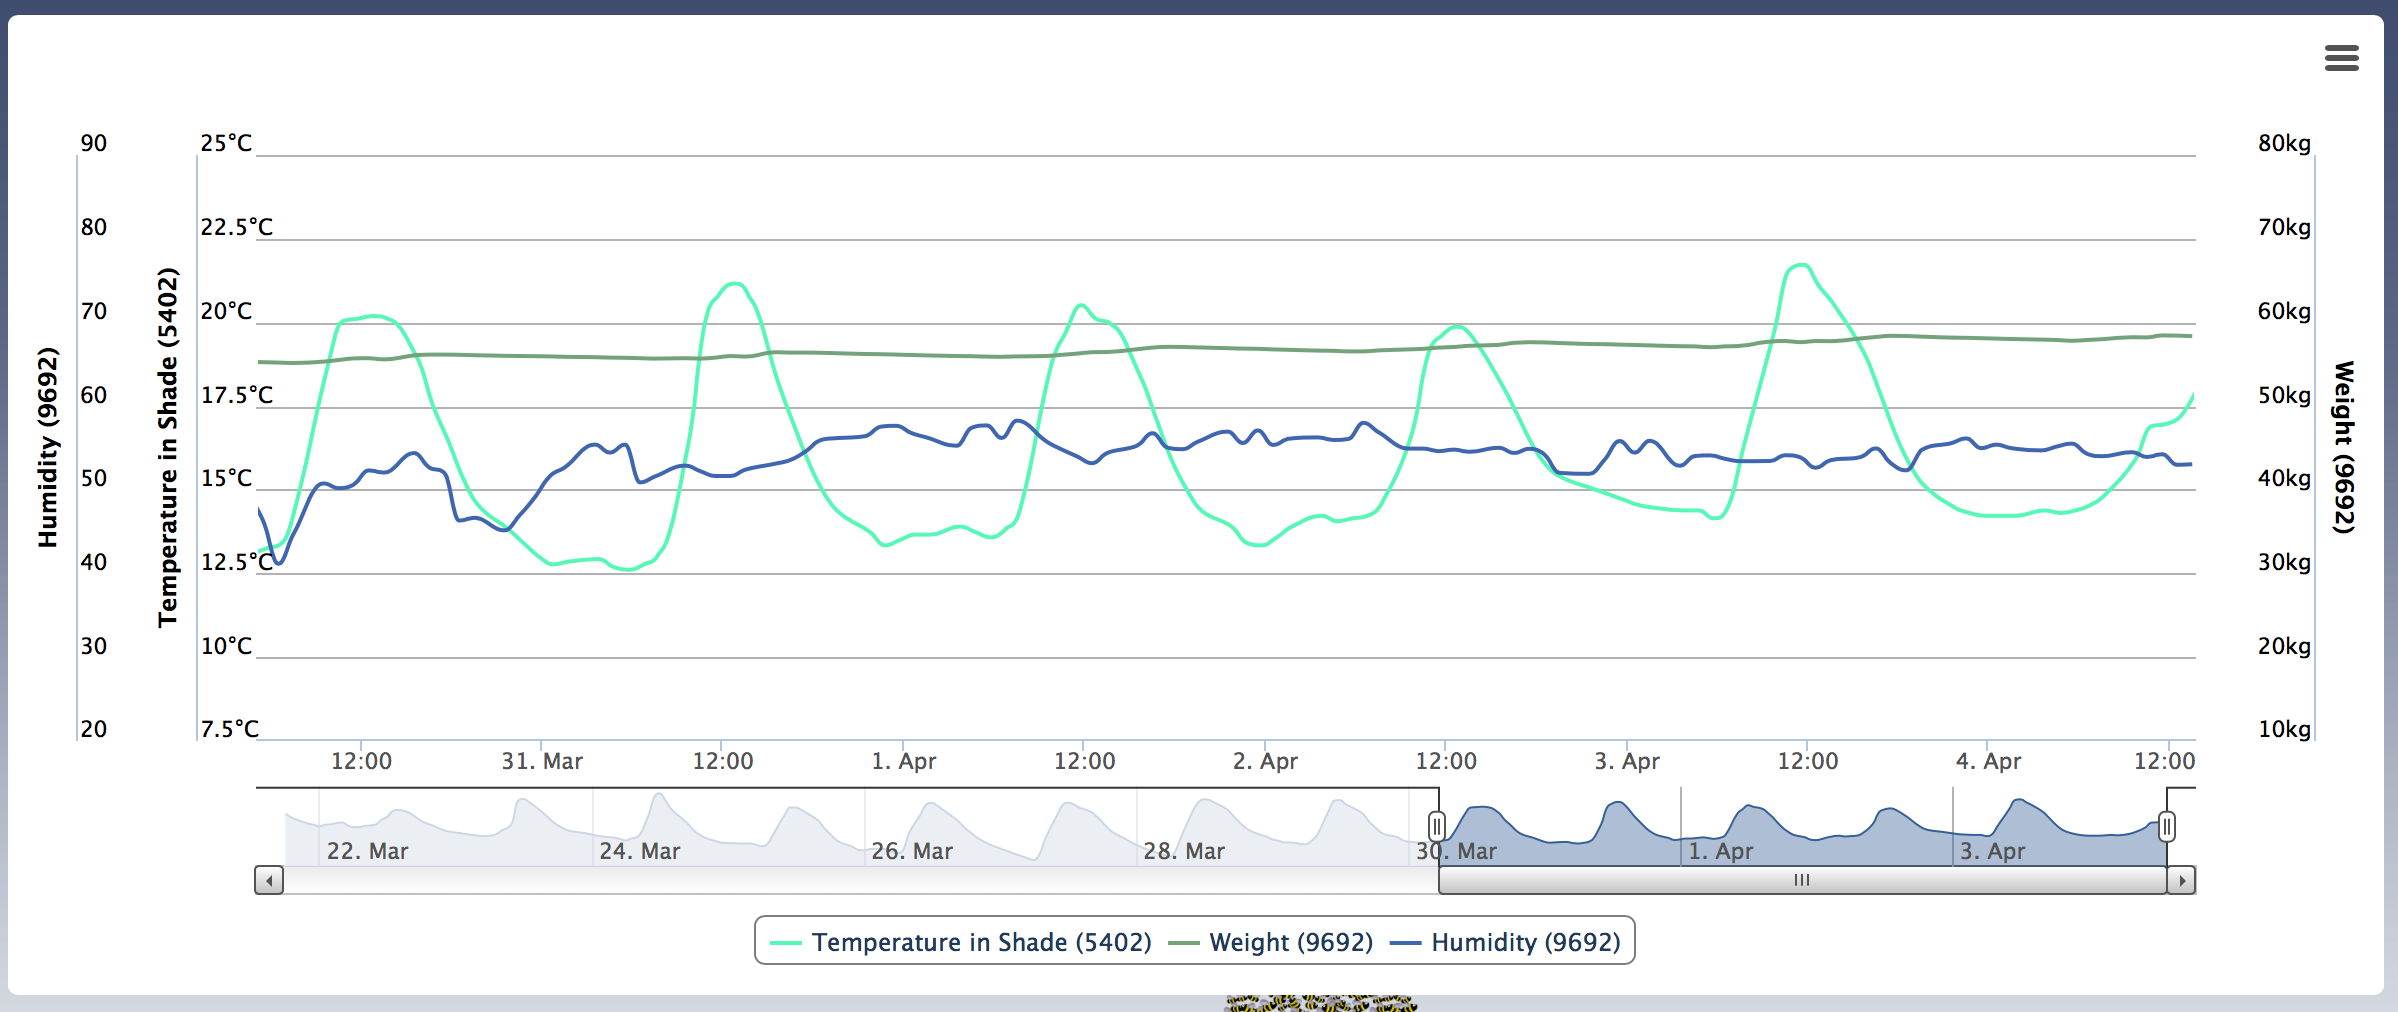
This graph is from my long hive, not a strong colony and I’ve been feeding some sugar syrup to build it up the last of which was consumed on 4 April sometime. The hive doesn’t get sun until 8ish. It is located in the Bunbury Area of WA.
This graph is from a friend of mine and shows the back end of the Marri flow. It is located a little further South on the Coast in the Margaret River area. It too is in a long lang, colony installed in Jan this year but still relatively small 14-16 frames.
I have checked the ambient temps versus the increases and there is a strong correlation for that first few hours of sunlight and weights going up. I’ll try blocking out the sun on the scale and see if that fixes it.
I’ve also got some internal sensors (temp and humidity). One placed in the brood section and the other on top of frames outside of the brood section. My humidity shows a spike in the brood area, which is also adjacent to entrance, around the same time as I see a small weight increase prior to flight.
In the spirit of “if you show me yours”… here is mine. The only thing I don’t like on the composite graph is that weight graph looks flat, as the Y-axis goes to zero and is not user-adjustable:
It looks like your hive has put on ~5kg over the period Dawn. Things must be blooming for you.
I’m going to have to play with my information a little more and get the composite graphs going to see if the trends I think I’m seeing are really there.
Having computer graphs is interesting to know as a hive increases in weight so where are you getting the software from to run it and any pros and cons about you scales or others that you decided were not for you.
I am guessing really what you are looking for is is a pattern of change then any sudden deviation to that pattern?
Cheers